代表キーワード :: 理工学
資料:680件
-
 親水・疎水性パタン化された有機薄膜の作成と利用(9月月報)
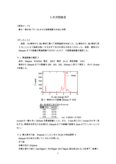
- 【行ったこと】 前回、Cu管球からMo管球に換えて感度曲線を作成した。Cu管球からMo管球に変えることにより強度は強くなるはずであるが変化があまりなかった。前回、管球からSampleまでの距離が最適距離ではなかったので、今回最適距離を確認した。
 550 販売中 2005/12/22
- 閲覧(1,201) コメント(4)
-
 グラフィクス表示と半導体内部状態描写への適用
- 第1章 序論 MOSトランジスタは、集積回路産業の中で重要な役割を果たしている。 MOSトランジスタの歴史は古く、バイポーラトランジスタより前に発明されている。実際、電界効果トランジスタの基本原理はJ.E.Lilienfeldによって1930年に考案され、現在のMOSトランジスタの構造...
 880 販売中 2006/02/06
- 閲覧(1,194)
-
 Population Growth
- First, the graph of the population versus time is about direct proportional. However, if we see the changes (difference between years), we can see the some differences. First, between 1801 and 1811, there is least population increase in the chart. Between 1811...
 660 販売中 2005/07/30
- 閲覧(1,180)
-
 Using Micro organism for Energy
- Introduction Modern economies need a steady supply of cheap energy. At present, we depend on fossil fuels and nuclear power, (Peaty 76) but this energy is limited, so it will disappear in the future. We must change energy system from nonrenewable energy to re...
 550 販売中 2005/11/04
- 閲覧(1,176)
-
 量子コンピュータ を学ぶ
- 「量子コンピュータ」というものがこの世で初めて定義されたのは1959年のことで、カリフォルニア工科大学の講演中にRichard Feynmanによって定義された。しかしこのときは理論上の話であり実用性については触れられなかった。 しかしそれから30年以上たった1994年ものすごいこと...
 550 販売中 2006/02/18
- 閲覧(1,163)
-
 テータベースレポート
- 例としてパソコンデータベースを考える. 簡単のため,テーブルは2つ「CPUテーブル」「本体テーブル」にし,それぞれの持つ属性は,本体(名称・型・CPU・メーカー),CPU(名称・Bit・価格・コプロ)とする. スキーマを考えると,図1.1の用になる. 図1...
 550 販売中 2005/07/27
- 閲覧(1,160) コメント(6)
-
 Evaporation and Intermolecular Attractions Lab.
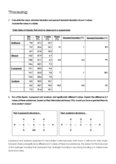
- 1.Calculate the mean, standard deviation and percent standard deviation of your t-values. Include the values in a table. 2.Two of the liquids, 2-propanol and acetone, had significantly different t-values. Explain the difference in t values of these substan...
 660 販売中 2005/07/21
- 閲覧(1,147)
-
 電子機能システム基礎論
- 電子機能システム基礎論Ⅱ 統計的パターン認識手法について、特に部分空間法、K-NN法、ニューラルネットワークについて述べる。これらは対象の特徴を利用して、いかに高精度にパターン認識を行うかという識別処理に分類される。 部分空間法 統計的な識別関数といわれる。標準パ...
 550 販売中 2005/07/27
- 閲覧(1,147)


